
Python: Netflix Movie Duration Analysis
Background and Analysis
This project aims to discover what has caused a potential decline in the average duration of movies on Netflix. To accomplish this, I employ data manipulation techniques to analyze movie duration trends between 2011 and 2020. I explore the Pandas and Matplotlib packages in Python to visualize my results. This project can be found on DataCamp upon completing the Intermediate Python course.
To begin this project, I created a dictionary from two lists consisting of movie release years and corresponding average movie durations.
# Create the years and durations lists
years = list(range(2011, 2021, 1))
durations = [103, 101, 99, 100, 100, 95, 95, 96, 93, 90]

# Create a dictionary with the two lists
movie_dict={'years':years, 'durations': durations}
Next, I imported the Pandas library to create a data frame from this dictionary. I also imported the Matplotlib.pyplot library to visualize any potential trend between the two fields in this data frame.
# Import pandas under its usual alias
import pandas as pd

# Create a data frame from the dictionary
durations_df = pd.DataFrame(movie_dict)

# Print the data frame
print(durations_df)
       years  durations
    0   2011        103
    1   2012        101
    2   2013         99
    3   2014        100
    4   2015        100
    5   2016         95
    6   2017         95
    7   2018         96
    8   2019         93
    9   2020         90
# Import matplotlib.pyplot under its usual alias and create a figure
import matplotlib.pyplot as plt
fig = plt.figure()

# Draw a line plot of release_years and durations
plt.plot(durations_df.years, durations_df.durations)

# Create a title
plt.title("Netflix Movie Durations 2011-2020")

# Show the plot
plt.show()
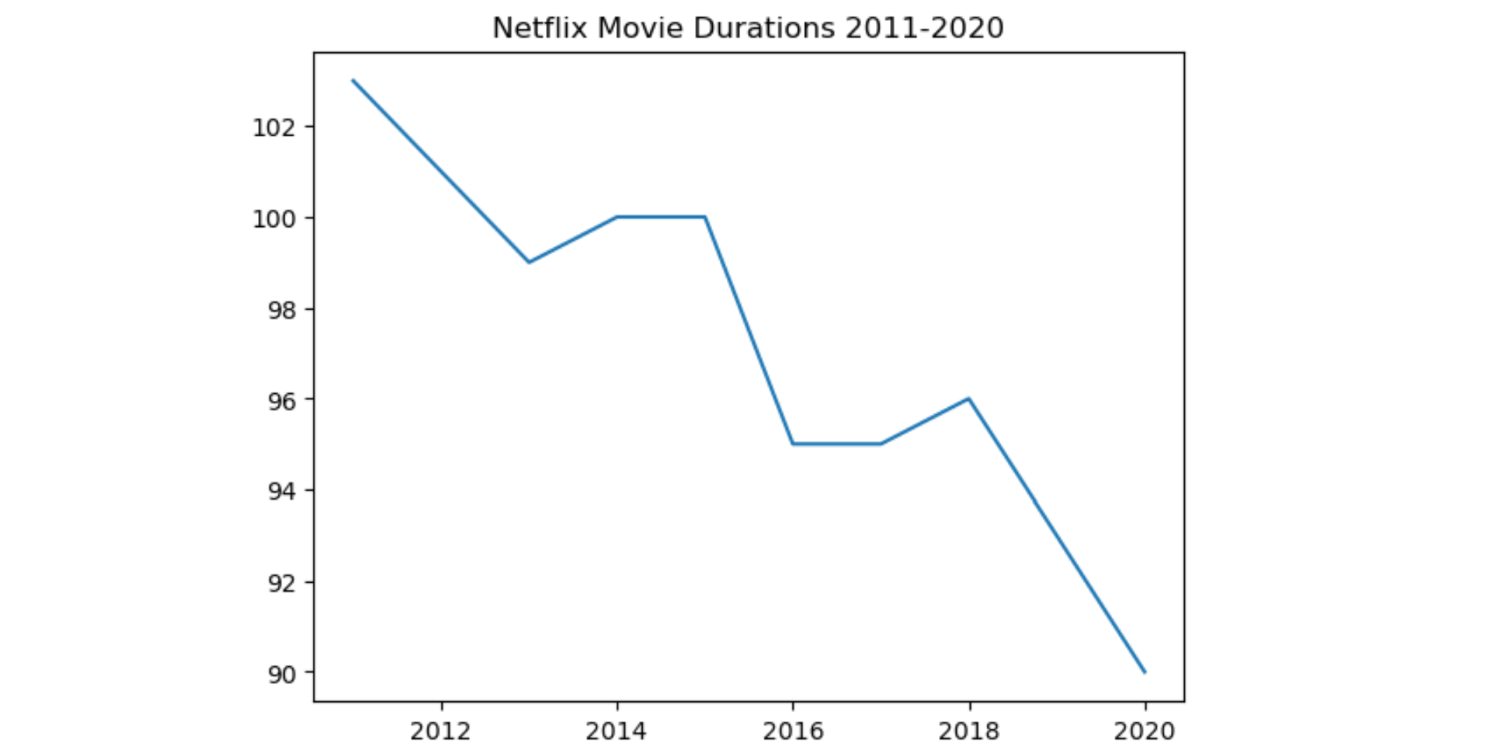
While there are only 10 observations in the visual, we have reason to believe there may be a negative trend between release year and movie duration. To begin this analysis, we can investigate a larger CSV file containing information on 7787 movies released between 2011 and 2020 with 10 informative field variables.
# Read in the CSV as a data frame
netflix_df = pd.read_csv("datasets/netflix_data.csv")

# Print the first five rows of the data frame
print(netflix_df.head(5))
   show_id     type  title           director  \
 0      s1  TV Show     3%                NaN
 1      s2    Movie   7:19  Jorge Michel Grau
 2      s3    Movie  23:59       Gilbert Chan
 3      s4    Movie      9        Shane Acker
 4      s5    Movie     21     Robert Luketic

                                                 cast        country  \
 0  João Miguel, Bianca Comparato, Michel Gomes, R...         Brazil
 1  Demián Bichir, Héctor Bonilla, Oscar Serrano, ...         Mexico
 2  Tedd Chan, Stella Chung, Henley Hii, Lawrence ...      Singapore
 3  Elijah Wood, John C. Reilly, Jennifer Connelly...  United States
 4  Jim Sturgess, Kevin Spacey, Kate Bosworth, Aar...  United States

           date_added  release_year  duration  \
 0    August 14, 2020          2020         4
 1  December 23, 2016          2016        93
 2  December 20, 2018          2011        78
 3  November 16, 2017          2009        80
 4    January 1, 2020          2008       123

                                          description             genre
 0  In a future where the elite inhabit an island ...  International TV
 1  After a devastating earthquake hits Mexico Cit...            Dramas
 2  When an army recruit is found dead, his fellow...     Horror Movies
 3  In a postapocalyptic world, rag-doll robots hi...            Action
 4  A brilliant group of students become card-coun...            Dramas
Looking at the “type” field, we can see there are also TV shows included in this data set. We can create a new data frame containing only “title”, “country”, “genre”, “release_year”, and “duration”.
# Subset the data frame for type "Movie"
netflix_df_movies_only = netflix_df[netflix_df['type'] == 'Movie']

# Select only the columns of interest
netflix_movies_col_subset = netflix_df_movies_only[['title', 'country', 'genre', 'release_year','duration']]

# Print the first five rows of the new data frame
netflix_movies_col_subset.head(5)
| title | country | genre | release_year | duration |
|---|---|---|---|---|
| 7:19 | Mexico | Dramas | 2016 | 93 |
| 23:59 | Singapore | Horror Movies | 2011 | 78 |
| 9 | United States | Action | 2009 | 80 |
| 21 | United States | Dramas | 2008 | 123 |
| 122 | Egypt | Horror Movies | 2019 | 95 |
We can now create a scatter plot visualizing movie duration over a longer range of time.
# Create a figure and increase the figure size
fig = plt.figure(figsize=(12,8))

# Create a scatter plot of duration versus year
plt.scatter(netflix_movies_col_subset.release_year, netflix_movies_col_subset.duration)

# Create a title
plt.title('Movie Duration by Year of Release')

# Show the plot
plt.show()
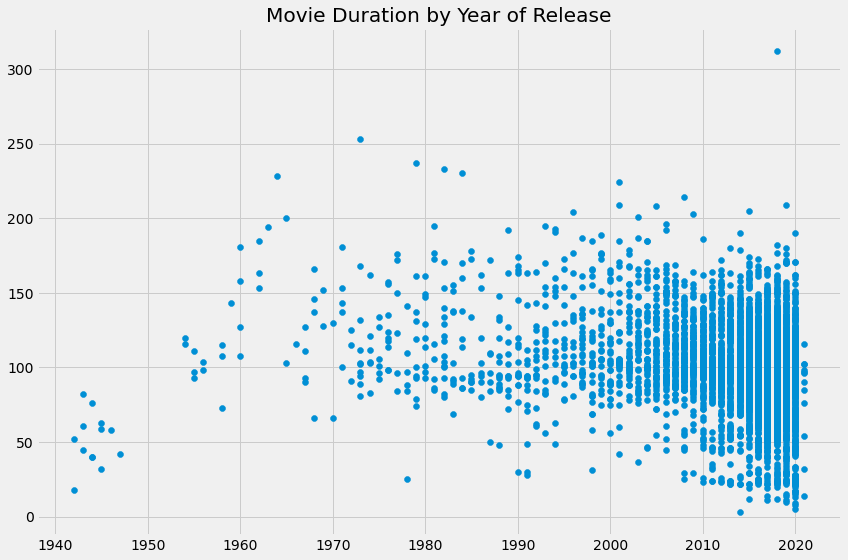
This visual is much more informative than the first line plot. While newer movies on Netflix are overrepresented, we can see that many short movies have been released over the past two decades. Additionally, many of these movies have been well over an hour long. To investigate which films have been lowering the average movie duration over the past two decades, we can filter the data frame by genre and movie duration less than 60 minutes.
# Filter for durations shorter than 60 minutes
short_movies = netflix_movies_col_subset[netflix_movies_col_subset.duration < 60]

# Print the first 20 rows of short_movies
short_movies.head(20)
| title | country | genre | release_year | duration |
|---|---|---|---|---|
| #Rucker50 | United States | Documentaries | 2016 | 56 |
| 100 Things to do Before High School | United States | Uncategorized | 2014 | 44 |
| 13TH: A Conversation with Oprah Winfrey & Ava … | NaN | Uncategorized | 2017 | 37 |
| 3 Seconds Divorce | Canada | Documentaries | 2018 | 53 |
| A 3 Minute Hug | Mexico | Documentaries | 2019 | 28 |
| A Christmas Special: Miraculous: Tales of Lady… | France | Uncategorized | 2016 | 22 |
| A Family Reunion Christmas | United States | Uncategorized | 2019 | 29 |
| A Go! Go! Cory Carson Christmas | United States | Children | 2020 | 22 |
| A Go! Go! Cory Carson Halloween | NaN | Children | 2020 | 22 |
| A Go! Go! Cory Carson Summer Camp | NaN | Children | 2020 | 21 |
| A Grand Night In: The Story of Aardman | United Kingdom | Documentaries | 2015 | 59 |
| A Love Song for Latasha | United States | Documentaries | 2020 | 20 |
| A Russell Peters Christmas | Canada | Stand-Up | 2011 | 44 |
| A StoryBots Christmas | United States | Children | 2017 | 26 |
| A Tale of Two Kitchens | United States | Documentaries | 2019 | 30 |
| A Trash Truck Christmas | NaN | Children 2020 | 28 | |
| A Very Murray Christmas | United States | Comedies | 2015 | 57 |
| Abominable Christmas | United States | Children | 2012 | 44 |
| Across Grace Alley | United States | Dramas | 2013 | 24 |
| Adam Devine: Best Time of Our Lives | United States | Stand-Up | 2019 | 59 |
Many of the movies that are less than 60 minutes long belong to genres like “Children”, “Stand-Up”, and “Documentaries”. This is a reasonable finding as one might expect these genres to have shorter runtimes when compared to 90-minute Hollywood blockbusters. We can explore how these genres may affect movie duration by changing their color in the scatter plot.
# Define an empty list
colors = []

# Iterate over rows of netflix_movies_col_subset
for index, row in netflix_movies_col_subset.iterrows() :
    if row['genre'] == 'Children' :
        colors.append('red')
    elif row['genre'] == 'Documentaries' :
        colors.append('blue')
    elif row['genre'] == 'Stand-Up' :
        colors.append('green')

    else:
        colors.append('black')

# Set the figure style and initalize a new figure
plt.style.use('fivethirtyeight')
fig = plt.figure(figsize=(12,8))

# Create a scatter plot of duration versus release_year
plt.scatter(netflix_movies_col_subset.release_year, netflix_movies_col_subset.duration, c=colors)

# Create a title and axis labels
plt.title('Movie duration by year of release')
plt.xlabel('Release year')
plt.ylabel('Duration (min)')

# Show the plot
plt.show
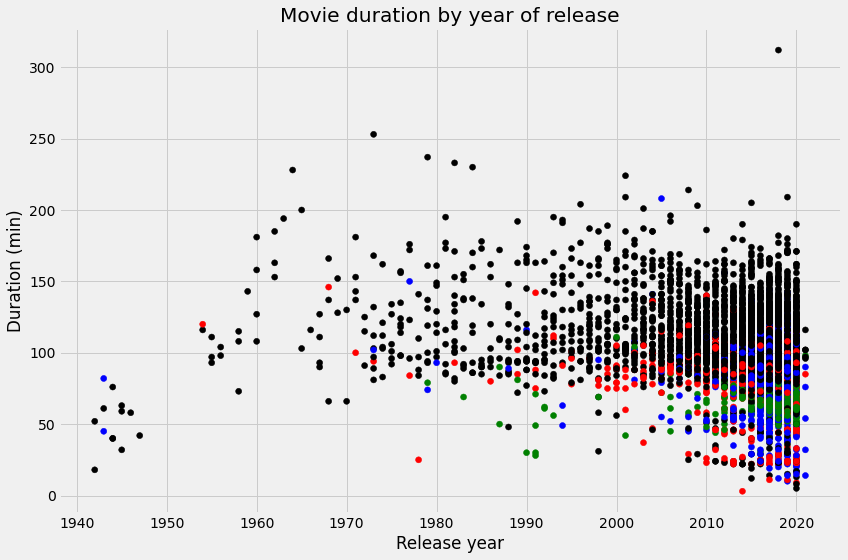
It is much clearer with this visual that the genres “Children”, “Stand-Up”, and “Documentaries” tend to have shorter movie durations. However, further analysis is required to assess the true impact these genres have had on average movie duration.